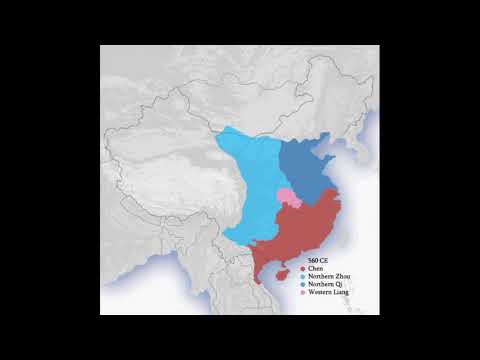
China - 3,000 Years of History in a Minute
EarthDirect
TOPIC · HACKER NEWS VIDEO ARCHIVE
Data visualization & information design is a topic archive of videos linked in Hacker News comments. This snapshot contains 53 videos and 367 labeled comments across 2010–2026. That is an average of 6.9 linked comments per video. The summed 164 recommender entries are counted per video, so one HN user can appear in more than one topic video.
This page answers “what surfaced more recently?”: videos are sorted by their latest Hacker News mention year. For a different question—“which talks have the most distinct recommenders?”—use the topic's Best Talks list when at least 20 talks are available. This topic has 17 cataloged talks. Its average per-video recommender count is 3.1; neither this metric nor recency represents YouTube views or a quality rating.
Topic labels follow the published taxonomy and may overlap. Use the filters to narrow by format, learning level, catalog shelf life, or how many distinct months a video received recommendations. Open a video record to compare it with same-topic videos and inspect its underlying HN context.
EarthDirect

The Globe and Mail

Google TechTalks

Don't Blink

TED
Page 2 of 2 · 53 videos are tagged with this topic. Videos are ordered by latest Hacker News mention.